i-Tree Hydro
For the latest i-Tree hydrology model developments, please refer to HydroPlus. Further development of the i-Tree Hydro graphical user interface is inactive until further notice. Ongoing model developments continue in HydroPlus as part of the i-Tree Research Suite of advanced scientific tools. HydroPlus, having a more technical interface, can be more challenging to use but also offers more flexibility and advanced modeling options. We are phasing out i-Tree Hydro free technical support as we focus resources on advancing research and model capabilities in HydroPlus and other Research Suite tools.
Application Overview
i-Tree Hydro is a flexible tool for users interested in comparative analyses of different land cover scenarios and their hydrological impacts at various scales. This tool is intended to be simple enough for non-experts to use, yet robust enough to provide defensible first-looks at the potential hydrological impact of land cover changes.
What is Hydro?
Hydro is a stand-alone desktop application designed to simulate the effects of changes in urban tree cover and impervious surfaces on the hydrological cycle, including streamflow and water quality, for watershed and non-watershed areas. It is the first vegetation-specific urban hydrology model, developed to model urban vegetation effects so natural resource managers and urban planners can quantify the impacts of changes in tree and impervious cover on local hydrology to aid in management and planning decisions.
Hydro is a combination of two modules. A base module designed to simulate hourly changes in stream flow due to changes in urban tree and impervious cover characteristics and a water quality module that uses outputs from the base program to simulate changes in water quality.
Ease of use guides development of i-Tree Hydro. Data requirements can be satisfied using preloaded and freely available data sets, and model flexibility allows for both watershed and non-watershed areas to be assessed. Navigating through project setup is simplified with clear steps, integrated help text within a user-friendly interface, and additional help text online. Understanding and making use of project results is made easier with an Executive Summary, various reporting options, and the ability to export outputs.
i-Tree Hydro V6 features
The latest Hydro version offers several features which extend the use of Hydro beyond the watershed to the city scale. Here are some of the features you'll find in i-Tree Hydro version 6:
- Users can now select a U.S. city and simulate water flow and water quality changes qualitatively, modeling tree and impervious cover changes and considering the relative changes in predictions between scenarios.
- Topographic indexes for U.S. cities, counties, states, and watersheds are now available, which eliminates the need for GIS skills to produce and import a digital elevation model.
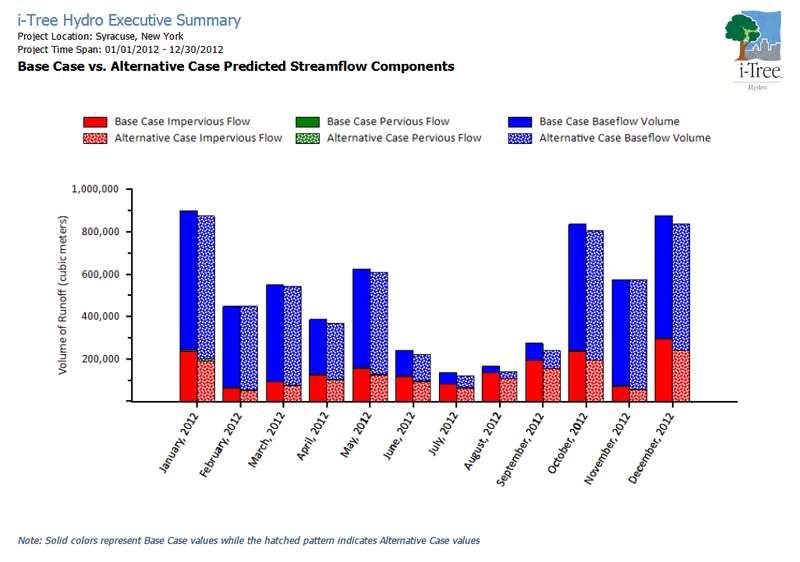
- A new Hydro executive summary report (Hydro Report Example) provides a quick snapshot of model simulation results.
- Enhanced graphics flexibilities and export options support model simulation results.
- Hourly United States weather data and steamflow data are now available for 2005 - 2012.
- An auto-calibration tool allows watersheds to be modeled quantitatively by finding a parameter set that effectively matches predicted streamflow with observed streamflow for base case (current) watershed conditions.
- A user-friendly dynamic help panel explains terminology and guides users through the entire modeling process.
- Output graphs show results for specific hydrologic processes (previously only in the background of Hydro simulations), including interception, infiltration, evapotranspiration, and more.
- More than 2 land cover scenarios can be stored within one project and modified within the same window, making it easier to organize and keep track of multiple comparisons.
- Each scenario can be paired with a unique parameter set, greatly increasing the model's flexibility for comparing subtly or drastically different land cover scenarios.
- A unique set of pollutant coefficients (Event Mean Concentration) values can be set and applied to projects as a basis for water quality predictions, instead of using the national U.S. average.
- Updated and improved software design for the user interface and backend model program.
Future updates in queue for Hydro V6 as funding becomes available:
- Green infrastructure* with unique parameterization for tree pits, rain gardens, bioretention basins, swales, green roofs, rain barrels, and porous pavement.
- Design Rain tool simulating storms using regional NOAA data and Intensity-Duration-Frequency (IDF) curves for the U.S.A.
- Curve Number tool for simple runoff prediction using the NRCS TR-55 method based on small-catchment hydrology studies, and built-in comparison of Curve Number model & Hydro model results.
- Climate-based simulations to assess the impact of land cover changes within 25-year past and projected-future climate conditions, based on the international, high-resolution NARCCAP model.
- Preloaded localized soil parameters from NRCS SSURGO data for the entire United States.
- Preloaded localized pollutant coefficients based on recent research from the USDA Agricultural Research Service and Hydro model developers.
* Green Infrastructure (GI) development status: GI was planned for release in the i-Tree Hydro V6 graphical user interface. Changes in the Hydro development team required an extended period for the development of i-Tree Hydro V6 updates. While Hydro V6 is now available, the latest research & development including for GI is continuing only in HydroPlus, an advanced scientific program in the i-Tree Research Suite. Technical users can access the latest GI features in HydroPlus.
Hydro Learning Resources and FAQs
- Get the Hydro User Manual from the i-Tree Manuals & Workbooks page.
- Find answers to common Hydro questions by visiting the i-Tree Forum's Hydro FAQs section.
- View instructional videos and webinars at the i-Tree Video Learning page.
- View past webinars and presentation materials at the i-Tree Presentation page.
- See how other users are applying i-Tree Hydro on the i-Tree Reports page.
- Visit the Hydro section of the Resources - Archives page to view technical papers and journal articles describing the underlying Hydro model methodology.
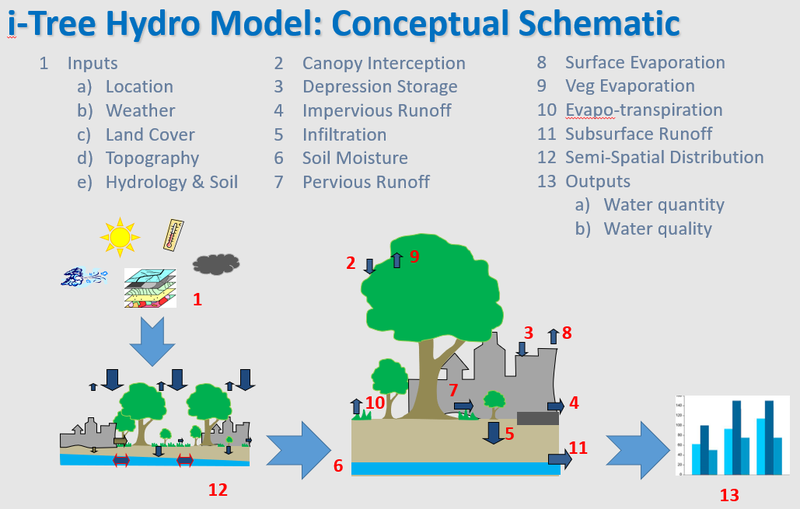
- i-Tree Hydro Model: Conceptual Schematic
What will Hydro tell me?
Given various changes in tree and impervious cover characteristics provided by the users, Hydro will quantify and illustrate hourly and total changes in stream flow and water quality. Data will be presented in tabular summaries as well as through graphs (hydrographs or bar graphs) that illustrate the changes between the base case (conditions as they are now) and an alternate case specified by the user.
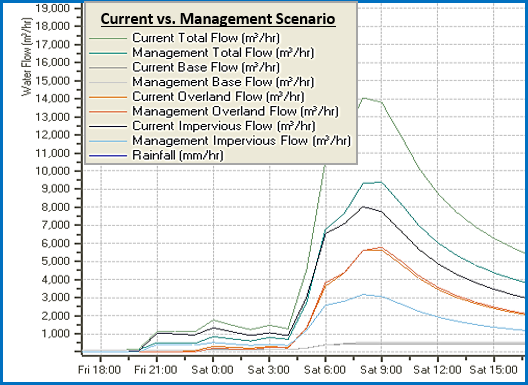
Most Hydro outputs can also be exported as images or tables. With Hydro's results in detailed tables, users can do their own post-processing to present a variety of scenarios in different formats. Below are a few examples of Hydro analyses prepared by the USDA Forest Service by post-processing exported Hydro results from many simulations.
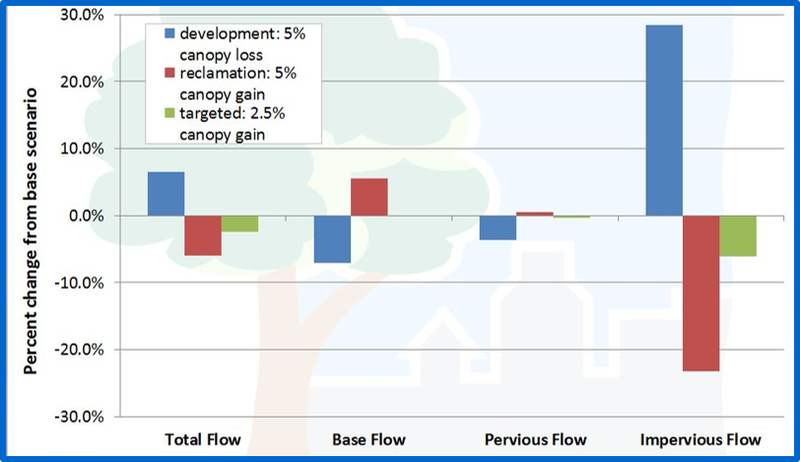
Comparing 3 land cover change scenarios in terms of effects on total flow and flow components.
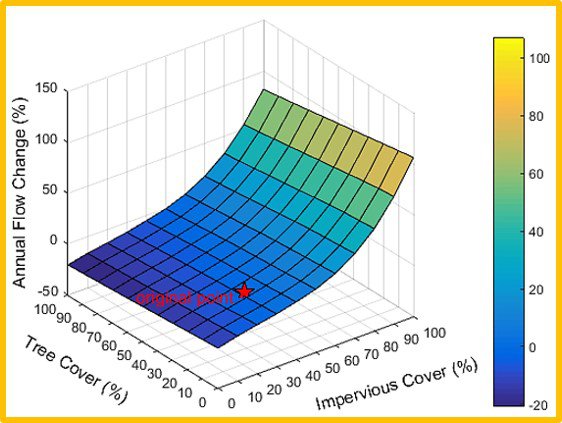
A gradient of potential land cover scenarios in a Washington, D.C. watershed
and the relative impact on total annual streamflow compared to current conditions.
Why is the information produced by Hydro important?
Urbanization significantly alters stream flows and water quality due to increased impervious surfaces, increased pollutants emitted from various sources and decreases in natural vegetation cover. These changes lead to increased runoff and flashiness of stream flow after storms, potential flooding issues, and poorer water quality that affect human health and well-being.
Through the Clean Water Act, the U.S. Environmental Protection Agency has designated various water quality requirements that affect city managers. As trees affect the environment, the ability to quantify these effects could lead to the incorporation of urban vegetation management strategies (and potential funding) to help meet these environmental regulations. Urban trees can potentially be used to meet clean water regulations associated with Total Maximum Daily Loads (TMDLs) and storm water programs.
How can Hydro help urban natural resource managers & urban planners?
The Hydro model could be used to explore how various best management practices (including urban forestry) affect water quality. In addition, by altering the precipitation inputs to simulate storms of various intensities, the model can be used to assess how management practices can affect local stream responses to storms. Model results can be used to inform urban forest management and urban planning and design to help improve water quality and reduce the risk of flooding.
Alternative stormwater models
There's a wide variety of stormwater models with different features. i-Tree Hydro focuses on being a flexible and easy-to-use hydrology model that explicitly simulates the hydrological effects of trees. Other useful modeling features that are not yet available in Hydro can be found in similar tools. Those features include climate change scenarios, design storms, and estimates of Low Impact Development costs and effects. If those features are important to a project you are modeling, the U.S. EPA's easy-to-use National Stormwater Calculator (SWC) or its underlying, more advanced Stormwater Management Model (SWMM) can be used.
Who developed Hydro?
The i-Tree Hydro model was originally developed as part of a SUNY College of Environmental Science and Forestry (SUNY ESF) PhD dissertation by Dr. Jun Wang, guided by his major professor Dr. Theodore Endreny at SUNY ESF, and PhD committee Dr. David J. Nowak, USDA Forest Service, Northern Research Station (NRS), Dr. James Hassett at SUNY ESF, and Dr. James Fawcett at Syracuse University. Drs. Endreny and Nowak have since guided i-Tree Hydro model development with SUNY ESF PhD students of Dr. Yang Yang, Thomas Taggart, and Dr. Reza Abdi, and Davey Institute employees Robert Coville, Megan Kerr, and Mike Binkley. Model refactoring and debugging has been assisted by Syracuse University Center of Advanced Computing and Engineering co-op students Shannon Conley (later with Davey Institute), Sanyam Chaudhary, Rahul Kumbhar, Yu Chen, Pallavi Iyengar, Jeevitha Royapathi, Isira Samarasekera, Vamsi Kodali, Sunit Vijayvargiya, Sneha Patil, Akshay, and Arpit Shah, and Nakul Sahayata. The code uses water budget algorithms developed for TOPMODEL by Drs. K.J. Beven and M.J. Kirby, map algebra algorithms developed for WhiteBox GAT by Dr. J. Lindsay, and low impact development algorithms developed for EPA SWMM by L.A. Rossman and W.C. Huber.
Many other individuals have contributed to the design, development, testing process, and help text including Robert Hoehn (USDA Forest Service NRS), Scott Maco (Davey Institute), Lianghu Tian (Davey Institute), David Ellingsworth (Davey Institute), Alexis Ellis (Davey Institute), Allison Bodine (Davey Institute), James Kruegler (Davey Institute), Andrew Lee (SUNY ESF), Dr. Tian Zhou (SUNY-ESF), and Dr. Emily Stephan (SUNY-ESF). Many individuals outside of the organizations developing this model have also contributed through advanced applications, extensive testing, and feedback - we are thankful for those efforts. The original manual was written & designed by Kelaine Vargas (Davey Institute), and it has been updated by Robert Coville (Davey Institute).
Last modified: August 25, 2020