i-Tree Streets Sample Inventory
Sample inventory projects
In a sample inventory, street segments (or linear plots) are selected according to the statistical principles of random sampling, and all the trees along the selected segments are inventoried. Sample inventories generally include 3-6% of all street segments, depending on community size and variation from segment to segment. This sampling rate has been shown to produce about a 10% standard error for the total number of trees citywide. A sample inventory workbook is included with the Manual to provide one method for drawing a sample inventory in any U.S. community using ESRI ArcGIS.
Data needs
The data needs of Streets depend on the nature of the output desired. Streets' adaptive nature allows for communities to tailor their sample inventory to meet their planning and assessment needs. Any combination of tree attributes can be inventoried as long as the species, diameter at breast height (DBH) and street segment IDs are known for every tree in the inventory. However, to utilize the full range of analysis and reporting features, users can follow protocols for Streets' default data fields as a guideline for field data collection. Additional information will be needed to describe and define the community, species information, and inventory parameters.
Inventory data
Users can utilize any combination of commercial or in-house software and data collection regimes to collect field inventory data. Whether paper-based or electronic, most inventories can be formatted for import or manual data entry after the inventory is completed. However, efficient and compatible complete inventory field data collection is facilitated by the integrated mobile web form or PDA Utility for hand held devices. In addition to inventory details, users can configure Streets to analyze up to 17 reportable data fields plus the new pest detection module. These data can be a combination of actual measured values or values classified as a range. Data fields are defined within the application and are customizable to meet the protocols and definitions of most any community's inventory needs.
Pest detection module
The pest detection option makes use of a newly developed, uniform and systematic protocol for assessing symptoms to help with early detection of pests and diseases. Following the protocol requires completing approximately 15 data fields for each tree, including checking the trunk, branches, and foliage for signs of stress, damage, or abnormal growth. Because of the nature of the protocol, these fields are not customizable within Streets.
Learn more >
Species data
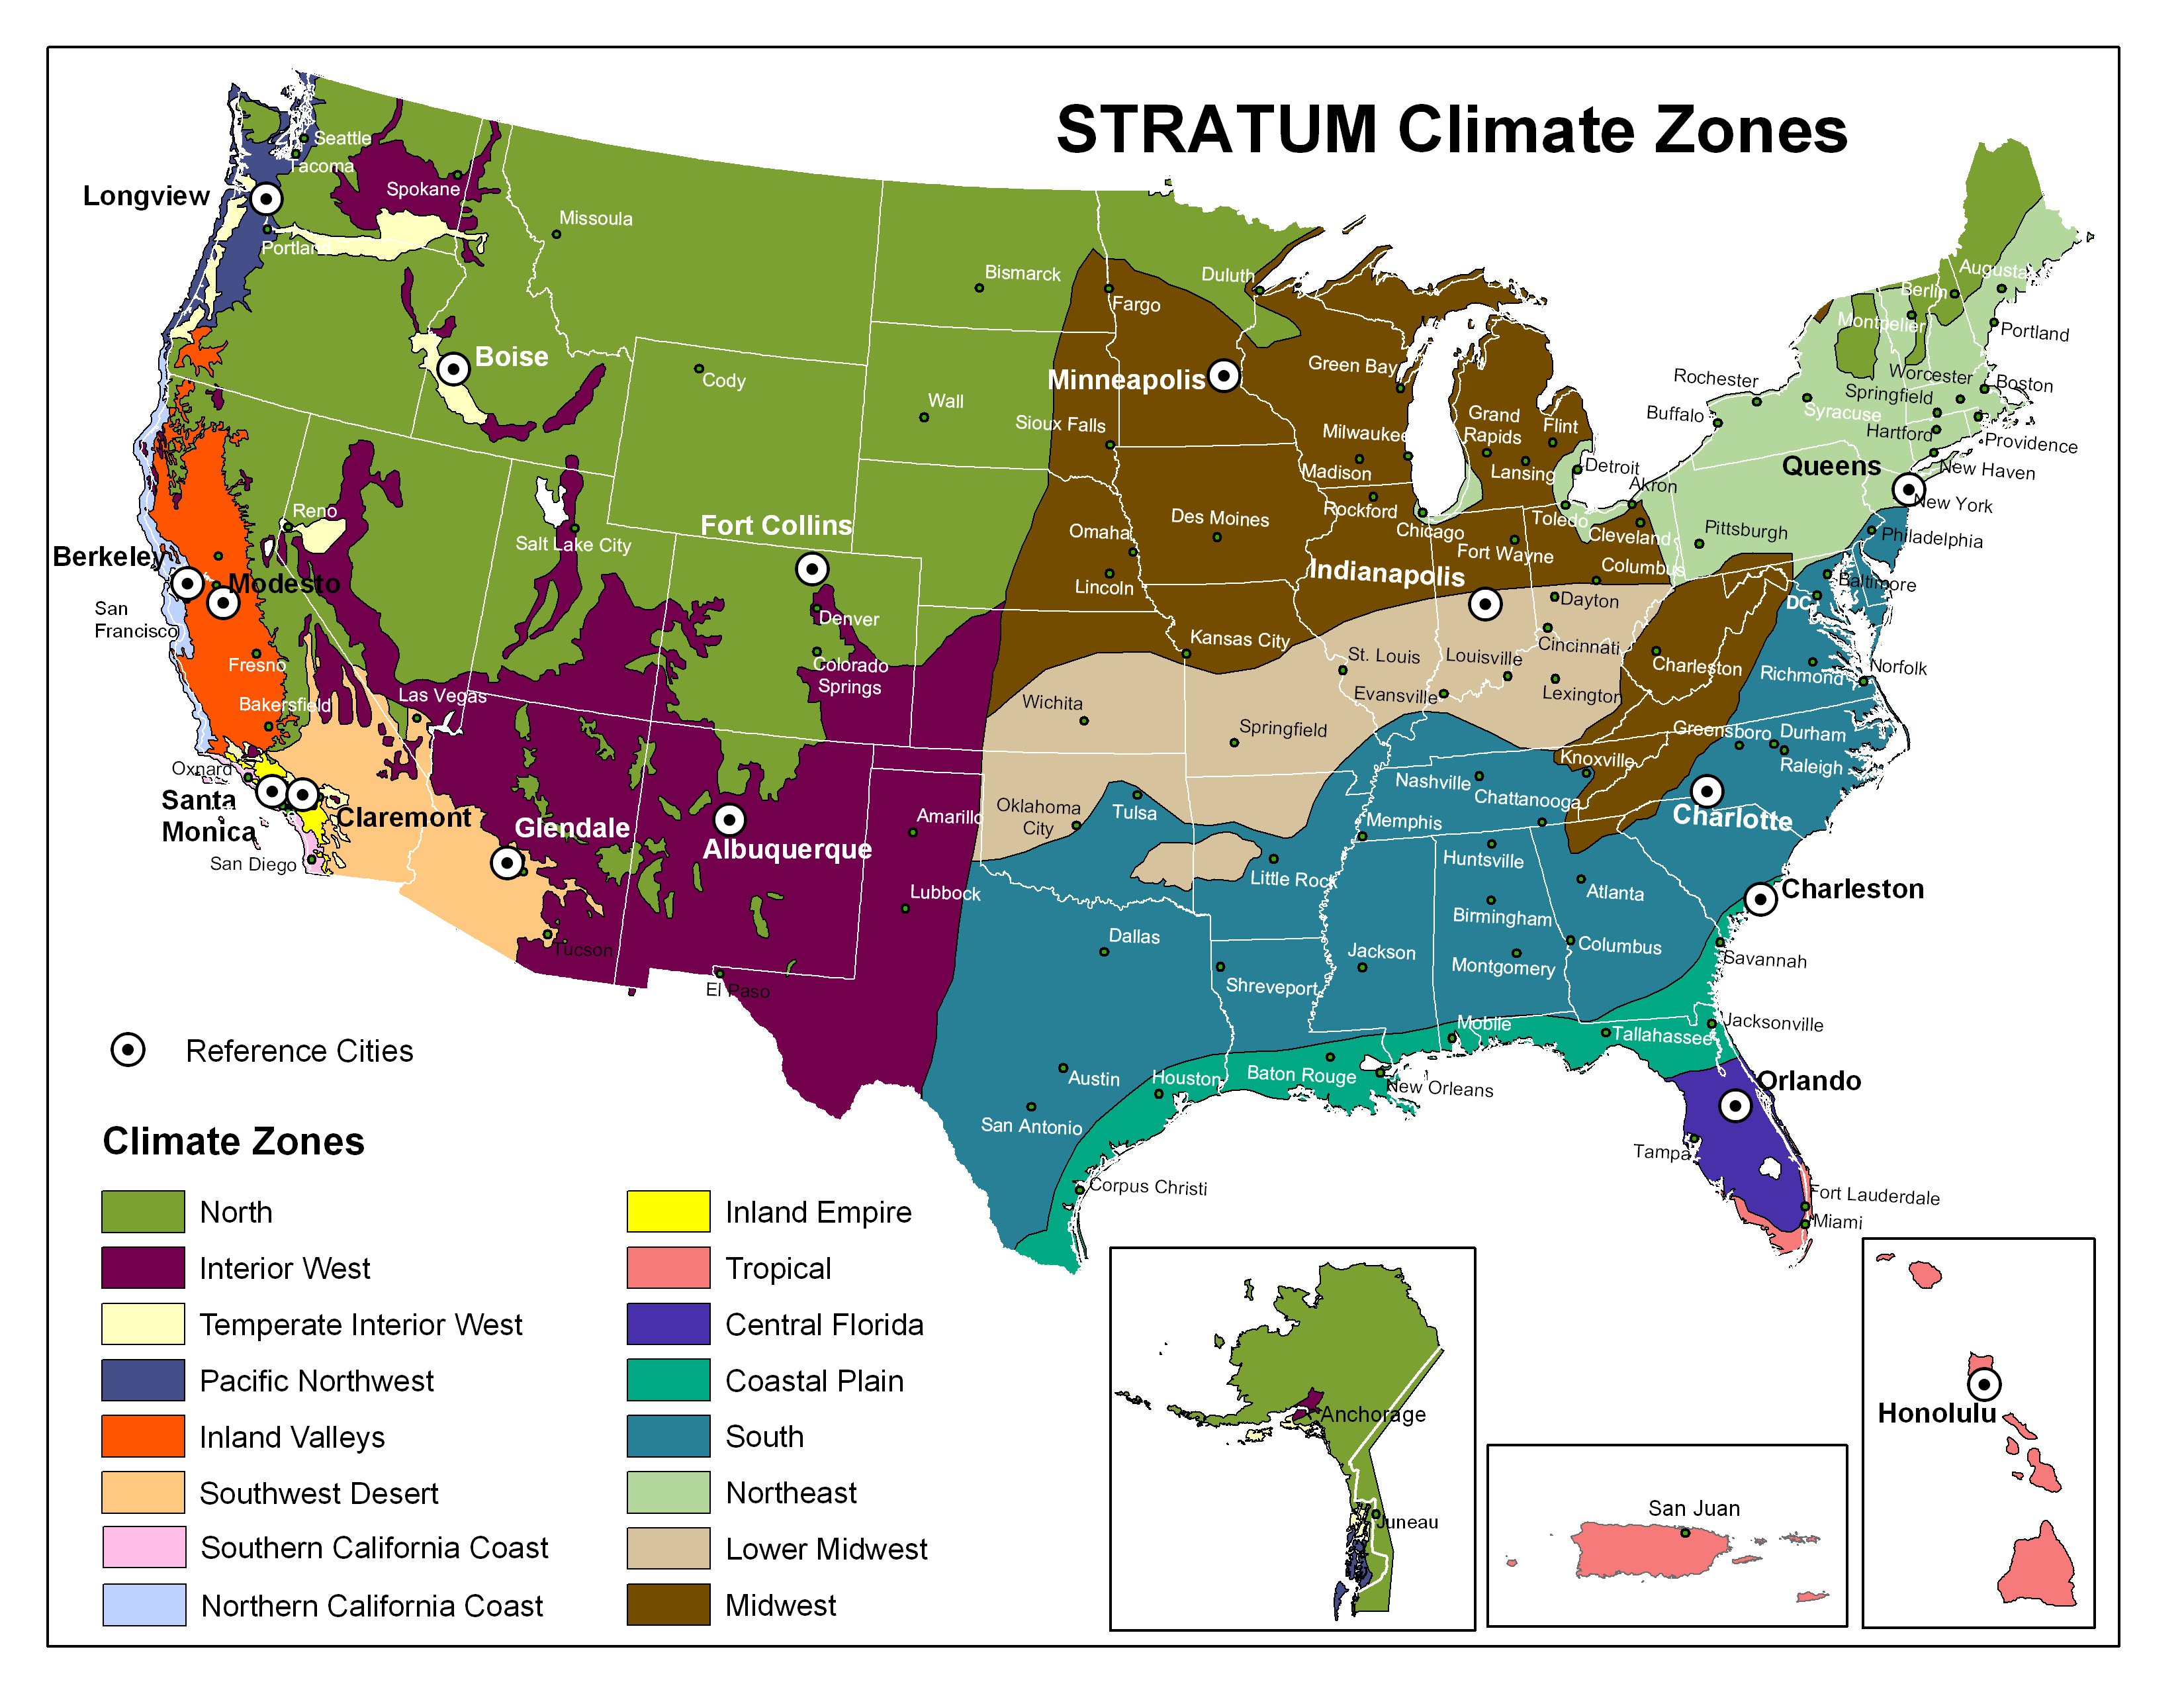
Streets has integrated species lists for each region's most predominant species to facilitate tree identification and Streets-compatible formatting, which requires species data to be imported in species code format (generally, the first two letters of the genus and species epithet combined to form a four letter code). For other data collection methods, Streets recognizes a comprehensive species list for each of the 16 national climate zones. However, most communities will find that after importing an inventory, several species will not be recognized. You will be prompted to define each unrecognized species with a species code, scientific and common names, and an allied match of species form and mature size (e.g., broadleaf deciduous large).
Management inputs
Though optional, city and costs data inputs allow users to utilize the full functionality of Streets' reporting features. For example, without entering street-tree program expenditures, users will not get a Benefit-Cost Ratio report, though benefit information will still be reported. The more information (inputs) you enter, the more information Streets will return in the form of reports.
City data
These data are information about a user's community that can be used by Streets to report per capita values for benefits and costs and canopy cover reports. Typically, these inputs are easily accessible data and include parameters such as total land area, resident population, and total linear miles of street are entered.
Cost data
To provide meaningful benefit-cost ratio reporting, users are encouraged to provide up-to-date, complete and accurate cost information. Cost data include all internal and external programmatic annual costs associated with managing the street tree resource (e.g., pruning and storm clean-up costs). While Streets will run without costs inputs, the benefit-cost ratio reported will reflect only costs entered by users.
Benefit data
Benefit inputs allows the user to define the dollar value of tree-related environmental services associated with street trees. For example, the cost of a single kWh of residential electricity charged to consumers in order to establish the dollar value associated with reduced summer energy use from tree shade. Default benefit values are included for each of the 16 national climate zones and are based on prices typical for the region. Users have the option of changing these values where more city-specific data are available.