i-Tree in EnviroAtlas
EnviroAtlas is a free, online mapping and decision tool developed by the U.S. Environmental Protection Agency (EPA) and partners. It provides interactive resources for exploring the benefits people receive from nature, or "ecosystem goods and services" (EGS). EGS are critically important to human health and well-being, but they are often overlooked. EnviroAtlas users can access, view, and analyze diverse information to better understand the potential impacts of decisions on EGS in order to capture their benefits and avoid unintended consequences for human welfare.
i-Tree Collaboration
As a partner in the EnviroAtlas community component, the USDA Forest Service (USFS) contributes dozens of data layers based on i-Tree tools:
- Carbon storage and sequestration
- Temperature reduction
- Air quality and filtration of pollutants
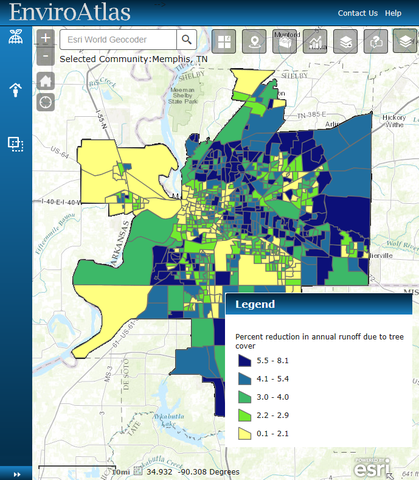
- Runoff and stormwater reduction
- Water quality and filtration of pollutants
- Economic value of pollutant filtration
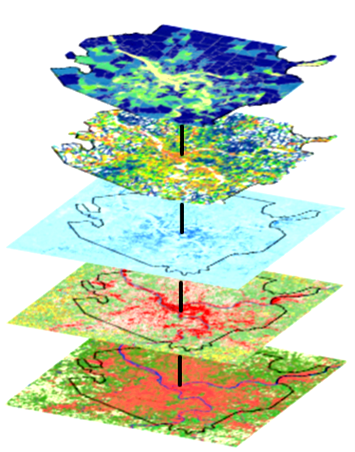
These are summarized to the census block group, currently for 18 U.S. urbanized areas. The metrics derive from high resolution (1 square meter) land cover datasets developed by the EnviroAtlas team using aerial photography and LIDAR data, along with supporting datasets such as roads and streams. Canopy type for the i-Tree metrics is determined using the most current National Land Cover Dataset. More than 30 i-Tree data layers are readily accessible in EnviroAtlas, where they can be viewed, downloaded, and accessed via web services, in conjunction with hundreds of other data layers for a more holistic understanding of EGS.
Integrating i-Tree with BenMAP
USFS develops additional layers for EnviroAtlas communities by combining the output of i-Tree tools with EPA's BenMAP-CE. This is an open-source computer program that assesses the effects of changes to air quality on human welfare. For a full description and links to download BenMAP, please visit the BenMAP homepage. Using BenMAP, USFS estimates the local impact of pollutants removed by tree cover on human health, mortality, and well-being, as well as the economic value of these impacts. EnviroAtlas includes more than 20 such data layers highlighting potential health-related benefits due to the removal of specific air pollutants by tree cover:
- Asthma and respiratory cases avoided
- Mortality avoided
- Hospital visits avoided
- Healthcare costs reduced
- Days of school not missed
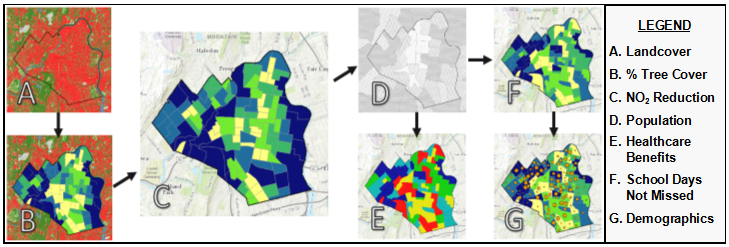
An example of how the EnviroAtlas team uses i-Tree tools and integrates i-Tree output into an EGS framework: EnviroAtlas generates a 1-meter resolution land cover data layer for each community (A), then calculates percent tree cover per US census block group (B). Along with local atmospheric and phenological data, this information is used to run i-Tree models and estimate (for example) annual reductions in NO2 concentrations due to tree cover (C). These reductions are allocated to populations using census data (D), and input into BenMAP models to estimate healthcare benefits — for example, healthcare costs reduced due to filtration of NO2 (E), or school days not missed due to asthma exacerbation cases avoided (F). These data can be contextualized by overlaying socioeconomic data, such as percent population other than white, non-Hispanic (G).
The Communities
Each EnviroAtlas community is delineated using the census block groups that fall within the census urban area for the principal city or town. Therefore, EnviroAtlas communities often contain multiple municipalities. Current plans are to include 50 U.S. communities by 2019. For an up-to-date list of completed and upcoming communities, please visit the EnviroAtlas communities page.
Contextualizing the Data
EnviroAtlas hosts hundreds of additional geospatial datasets at the national and community levels which may be used to inform decision making. For example, simply identifying census block groups where temperature reduction due to tree cover is minimal can help guide tree planting efforts. However, social and economic factors can be considered by overlaying maps of low-income prevalence, density of public transit stops, and walkability of neighborhood street networks. Assessing these data in concert allows users to evaluate how to reduce the urban heat island effect in key areas of exposure while simultaneously affecting social justice, enhancing transportation services, and promoting physical activity. Other data layers hosted in EnviroAtlas describe:
- Demographics
- Land cover and land use
- Work, employment, and transit metrics
- Schools and daycare centers
- Vegetative buffers along roads and streams
- Biodiversity metrics
- Civic infrastructure
- Agriculture
For a full list of available map layers, explore the searchable dynamic data matrix.
NYC: an EnviroAtlas Use Case
The New York City Department of Parks and Recreation (NYC Parks) recently used EnviroAtlas data layers developed by EPA and USFS to help evaluate the local distribution and benefits of green infrastructure. NYC Parks summarized reductions due to tree cover in stormwater loads, ambient temperatures, and air pollution-related healthcare costs for key neighborhoods across the city. Project staff also summarized additional EnviroAtlas and local data on where green space promotes healthy lifestyles. Their results show that even densely populated areas can provide benefits from green infrastructure. NYC Parks staff also compared the relative social, economic, and health benefits provided across neighborhoods. For example, despite lower population density, the culturally diverse neighborhood of Bensonhurst, Brooklyn, receives fewer EGS benefits than the wealthier Lower East Side, Manhattan. Contextualizing these data according the needs of the local community may prove invaluable to decision makers as they manage future green infrastructure development.
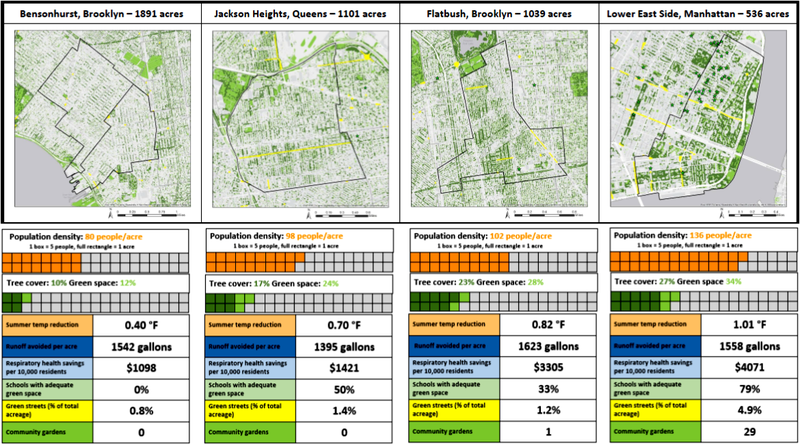
EnviroAtlas and local data summarized to neighborhoods by NYC Parks to illustrate several economic, health, and civic benefits provided by green infrastructure across NYC.
